Showing posts with label Amiel816. Show all posts

Friday, March 9, 2012

Amiel's Surface Area Post


T [LxW] 5 x 10= 50 cm
F [LxW] 6x10 = 60 cm
S [LxW] 6x5 = 30cm
----------------------------------------
TSA= 2 (T+F+S)
= 2 (50+60+30)
= 2 (140)
= 280m2


8+9+10=27
5x27= 135cm
= 36cm
= 36cm
_______________________
TSA= 207cm2


AOBxH
bxhxh÷2
8.5x3 ÷2 =
12.75 x 5= 63.75cm3
HOBxH
lxwxh
20x8x16= 2560cm3

AOBxH
BxHxH÷2=208cm3
208÷2=104cm3
104÷8=13cm3
13x3= 39cm3
V=πxrxrxh
V=3.14x6x6x15
V= 1695.6cm3

Monday, February 13, 2012

Amiel's Pythagoras Post 4, 5, 10

4.what are the areas of the square?

e=30mm
e= 30²
e=30x30
e=900mm
²

f=40mm
f=40²
f=40x40
f=1600mm²

g=50mm
g=50²
g=50x50
g=2500mm²

5. A right triangle has side length of 40mm, 75mm, and 85mm.
a) Sketch the right triangle and draw squares around each side of the triangle.

b) What are the areas of the three squares?

A=40mm B=75mm C=80mm
A=40² B=75² C=80²
A=40x40 B=75x75 C=80x80
A=1600mm B=5625 C=7225


c) Write an addition statement using the areas of these three squares.
A
²+B²=C²

1600+5625=7225

10. A triangle has the side lengths of 120mm, 160mm, and
200mm. Is the triangle a right triangle? Explaing your reasoning.


a+b=c
120+160= 280
280≠200

It is not the a right triangle because the leg of the triangle did not equal the hypotenuse.


Sunday, February 5, 2012

Pythagorean relationship

1. Answer in a short paragraph and with diagrams
Relationship between the sides of the triangle is any right triangle that has one right angle if the length of the legs(A and B) are squared and their sum is found, the sum will equal to the square of the hypotenuse(C).
2. Solve for the missing side length.


3. Is this a right triangle? Prove it!!!


It is not a right triangle because it does not equal 121.

Sunday, January 22, 2012

Textbook Questions 4, 8, and 9

4. Estimate the square root of each number, to one decimal place. Check your answer with calculator.

A.)
Square root of 72 is close to the halfway point of 66 and its square root is 8.1 and 72 is 4 numbers away from it. So the whole is 8 and the decimal is 4.
B.)
The square root of 103 is 10.1. For the whole it hasn't reach pass 11 so it is 10 and for the decimal I just counted how far it is from.
C.)
The square root of 55 is 7.5. for the Whole once again it has now pass 64 so therefore it is 7 and for the decimal I just rounded 49 by 50 then counted how far 50 is from 55 and I got 5.

8.) Identify all possible whole numbers with a square root larger that 2 and smaller than 3
2x2=4
3x3=9
5,6,7,8

9.) Identify all possible whole numbers that have a square root between 4 and 5.

4x4=16
5x5=25
17,18,19,20,21,22,23,24

Sunday, December 11, 2011

Amiel's Scribe Post

Page 150-151
Unscramble the letters for each puzzle. Use the
clues to help you solve the puzzles.
1. R C E E T N P
Percent means out of 100.
2. C R A T F I O L N A
A Fractional percent is a percent that
includes a portion of 1%.
3. M C N O B D E I
Percents that are added together
are Combined percents.
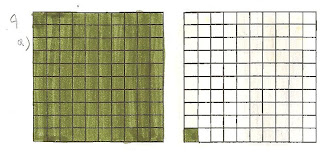
4. How many hundred grids are needed to
show each of the following percents?
a) 101% b) 589% c) 1450%
It will take about two hundreds grid.
b) It will take about six hundreds grid.
c) It will take about 15 hundreds grid.
9. Copy and complete the following table.
The first row is done for you.
Sorry if some of the grids are a little blury my scanner didn't scan the colors well enough.

Sunday, November 13, 2011

Amiel's Graphing Post

1.)Bar graphs - Bar graphs are best for comparing data across categories.
Advantages:
Represents data easily
Easy to make
Gives you results easier.
Disadvantages:
Graph categories can be reordered to emphasize certain
effects
Use only with discrete data
Limited space for labeling with vertical bar graphs
2.)Double graphs - Double Bar Graphs are good for comparing two sets of data
across categories.
Advantages:
Great for comparing two sets of data.
Represents data easily
Disadvantages:
Not all intervals might work.
3.)Circle graphs- Circle graphs are best for comparing categories to the whole using percents.
Advantages:
Compares categories in parts of a whole using percents.
Disadvantages:
Its hard to get the percents of the categories.
4.)Line graphs- Line are best for showing changes over time.
Advantages:
Shows changes overtime.
Disadvantages:
Its harder to identify the intervals
5.) Pictographs - Pictographs are best for comparing data that can be
easily counted and represented using symbols.
Advantages:
Easy to read
Disadvantages:
They all have to be the same size.
There are three ways a graph can be misleading.
1.) Changing the size of the bars - Making it look 3D, Making one look much
bigger than the other.
2.)Changing the scale - Making a break in the Y-axis.
3.)Making one picture look bigger.
2a) The following chart shows Pizza Sub Sales over a month. What 2 graphs would
show the information accurately?
2b) If you were selling Pizza Subs would you
continue? How does your graph explain your answer.
2A)I would use a pictograph so the data can be easily seen by percents, and it would also show how much people are buying.
2B)They should continue selling because there are many people buying pizza subs.
A.)Below you see 2 different examples of graphs showing healthy choices
sold at thecanteen. If you had to convince Mrs Mota that we should continue
sellinghealthy choices which graph would you choose?
B.) Change each graph so that your information looks even MORE impressive.
You may not change the data just the graphs.
A.) I would prefer a bar graph and circle graph because judging by the height of the bars amd the size of the collumns on the circle graph more and more people are eating healthy food choices.
B.) Modified Graphs
Note: All Graphs are created by me at createagraph.gov so don't accuse me of copy and pasting these graph just because they are perfect.

Saturday, November 12, 2011

Amiel's Pay It Forward

Part 1
Pay it forward is an idea that helps people and is passed on to another person that is in need of help on something.
Part 2
My act of kindness was helping a fellow friend that has issues on handeling a bully, offending insults and controling his temper.
I choose this activitiy because I thought it would be a good idea to help out a friend and it would be a good way to show an example on helping a another person.
I helped out one of my friend that some trouble on a bunch of things.
I gave my friend some tips or advice on how to control his temper when he is being bullied, insulted and made fun off. I showed what he should do and when to react.
I did my act of kindness at thursday after school I went to my friends house and starded helping him.
Part 3
My act of kindness went well and it went according to plan and my friend now knows what to do to take a stand.
When my friend knew what to do against insults, bullies and other hurtful things, he was greatful to have me as a friend.
When I started my act I felt the same pain that my friend did when he was bullied. I was bullied when I was a kid evertime all the time I always get bullied. For those past 3 years of pain, It never turned me down. I never gave up to take a stand, this is why I wanted to help my friend.
When I ask him some questions on how he fells when he gets bullied his reaction was sad, mad, angry and hurt.
I ask my friend to pay it forward by sharing the tips I gave him and to show other people what is like when you are bullied.
His reaction was excited and shy but he knew some people will need the ideas and advice.
Part 4
I think the idea pay it forward is a very good idea because it could get people to care for each other. Not just themselves but for everyone, so people would open their eyes and see how much people that are in desperate need of help.
I think my act of kindness made a difference because It could help help alot of people and it could show how people fell when they are bullied, insulted offensively and made fun off.
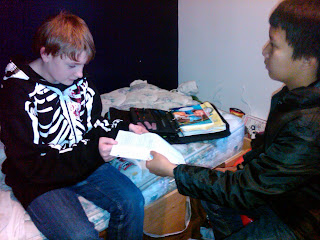
A picture of me giving my friend a helping hand.
A video on what he thinks of bullies.

Tuesday, October 11, 2011

Amiel's Proportion Post

Amiel's Proportion Post

Ratios-are comparisons between two different things. For example ratio of apple and oranges in groups. Suppose there are thirty-five fruits fifteen of them are apples, the ratio of apples and oranges are 15 to 20.

Rates-are ratios are in two different quantities measured in units, it can be expressed as a fraction but not percent.

Proportions-are two equal ratios a proportion has 2 equivalent fractions (ratios).

Examples:
Ratio 4:5 Blue balls to orange balls.

Rate- 5 candies cost 10

2/Candy

Proportion-


1. 5 hours to travel 360 miles is about _____mph.
2.As a playgroup worker, if I increase the amount of apple juice I am serving at the playgroup from 25 ml to 100 ml, how much should I increase the the orange juice to, to keep the quantities in the same proportion? The orange juice is 50 ml to start with.

1.5 hours to travel 360 miles takes about 72 mph.

I would increace it by 4.

3/4 = 12/16 are equivalent
4/9 = 16/32 are not equivalent


It is not fair!


If I was the judge I would sentence Roy Brown to only 1 month and sentence Paul R. Allen to 15 years to jail.