Showing posts with label Charry 8-16. Show all posts

Friday, March 9, 2012

Charry's Surface Area and Volume Post

Volume


Triangular Prism
V=(bxh ÷2) H
V=(3x5
÷2)8.5
V=(15
÷2)8.5
V=7.5 x8.5
V=63.75m3


Rectangular Prism
LxWxH
=20x8x16
=2560cm3


Triangular Prism (3/8 full)
( bxh÷ 2 ) h
( 8 x 4 ÷ 2 ) 6.5
( 32 ÷ 2 ) 6.5
=16 x 6.5
=104 cm
³


Cylinder
π r 2
3.14x6x6
=113.04

lxw
113.04x15
=1695.6cm
³

SURFACE AREA

Rectangular Prism


l x w
T-10x5= 50m2
F-10x6= 60m2
S-5x6= 30m2

TSA= 2(TFS)
=2(50+60+30)
=2(140)
=280m2


Triangular Prism

l x w
9x8=72cm2
9x8=72cm2
10x5= 50cm2
9x5= 45cm2
8x5= 40cm2


Cylinder


Tuesday, February 7, 2012

Charry's Pythagoraen Relationship Scribe post

1. Answer in a short paragraph and with diagrams
The relationship between the lengths of the side of the right triangle. The sum of the areas of the squares attached to the legs of a right triangle equals the area of a square attached to the hypotenuse.


Saturday, January 21, 2012

Charry's Estimating Square Root Scribe Post

What is square root?
-Square root is the inverse of squaring.
-It is a number multiplied by itself.


A Square Root van be thought of as aside in a square.


You can find the approximate of a number using perfect square. the whole number is the same as the smaller perfect square for all in between.


To estimate a fractional √ we can find find the whole number.
-To find the denominator of the fraction we subtract the perfect squares.
(25-16=9)

-To find the numerator we count the

positions between a


perfect squares.


Textbook Questions
5, 12,and 15

5) estimate each value, to one decimal place. Check your answer with calculator.


12) While shopping online, Ji Hun finds a square rug with an area of 11

m² . He needs to know if it will fit in his 4mx5m bedroom.

a)Estimate the side length of the rug, to one decimal place.


b)Check your estimate with a calculator.

3.316

c)Will the rug fit? Explain.

Yes, because the area of the bedroom is 20m² . The square root of the area which is 20 is 4.472 and the square root of the rug (11) is 3.316 .

15) Order the following numbers from least to greatest 7, √46, 5.8,√27,6.3

7x7=49

√46

6.3x6.3= 39.6

5.8x5.8= 33.8

√27

answer: √27 ,5.8,6.3,√46 ,7

Wednesday, December 14, 2011

Charry's Percent Scribe Post

COMBINING PERCENT

1) Discount- What you save.
2) Sale Price- What you pay after discount.
3) Total Price- Sale Price and Taxes

How To get the Discount.
Make the percent to decimal. 25% ÷ 100= 0.25 Then,multiply the decimal to the original price.
0.25x$75=$18.75 so, the discount is $18.75

How to get the Sale Price.
Subtract the original price and the discount to get the sale price. $75-$18.75= $56.25 So, the sale price is $56.25

How to get the Total Price.
The tax is depend to which country you are. So, our tax is 12% or 0.12 or 1.12
There's two ways to get the Total Price.
1) you can multiply the Sale price and our tax which is 0.12
So, $56.25x0.12=$6.75 then Add $56.25+$6.75 and you'll get $63.
2) You can multiply the sale price and 1.12
$56.25x1.12 and you'll get $63


Chapter Review 150-151

1) R C E E T N P
Percent means out of 100
2) C R A T F I O L NA
A Fractional percent is a percent that includes a portion of 1%Add Image
3) M C N O B D E I
Percents that are added together are Combined Percents.

11)


12)

Sunday, November 13, 2011

Charry's Pay it Forward

Part 1
Pay it forward is doing good things to other people and making a difference for them.

Part 2
My Pay It Forward act of kindness was to help my auntie's friend who's disabled.I did this with my partner Kate Velasco, I decided what are we going to do. I chose this activity because I like to help (old) people with disabilities. We helped Precilla Malla, we call her tita (auntie) Malla, she's 59 years old, shes disabled with psoriasis arthritis and diabetes since 2003. We asked her what can we do for her. We did this act of kindness last November 13, 2011 at 11:30 A.M to 3:30 P.M.


Part 3
Our act of kindness went well . First I introduced Kate to her , we asked her "what can we do for her?".
We saw her kitchen, there's a lots of dirty dishes . So , we washed it , we cooked rice for her, we swept the floor, we cleaned her table. We saw her bedroom and she asked us is it okay to help her fold some of her clothes "yes we can". I noticed that her bedroom is crowded with her things and a little bit messy, I told her that we can do some "interior designing here". We moved some stuff, while we're cleaning up, we were talking,sharing stories like her experience when she's young. We're done at that time. We asked a permission, if we can take a video and a photo to her. She approved. She was so happy when she saw her bedroom was all cleaned up.She told us that she's going to pay but we told her that its okay because we did this for free and she doesn't have to.She's thankful to us . She want us to visit and to come back if we have a free time. Kate and I had so much fun.I'm so happy because we make her (Tita Malla) so happy and Kate and I helped each other to take pictures and videos and to help Tita Malla.

Part 4
Pay it forward is important because you share good things to others.


Tuesday, November 8, 2011

Charry's Graphing Post

  • Data can be presented using bar graphs , double bar graphs , circle graphs , line graphs, and pictographs.
  • Different graphs may provide different information and display certain types of data better.

    Bar Graph
  • Advantage: Bar Graph is the best for comparing data across categories.
  • Disadvantage : When you make a bar graph you can't really see what is the exact number or its difficult to identify.


  • Double bar Graphs
  • Advantage: are best for comparing two sets of data across categories.
  • Disadvantage:Use only with discrete data

  • Circle Graphs
  • Advantage: are best for comparing categories to the whole using percents.
  • Disadvantage:you'll take more time doing and finding the percent.


    Line Graphs

  • Advantage: Line Graphs are best for showing changes in data over time.
  • Disadvantage-it use only with continuous data.


    Pictographs
  • Advantage:are best for comparing data that can be easily counted and represented using symbols.
  • Disadvantage: It is good for only whole numbers .
2. How can graphs be misleading. Show it 3 ways.

      • 1. Distorting the Scale (break the y-axis)
2.Distorting the Visuals (drawing different sizes for the pictographs)
3.Distorting the size of the bar (make the bar 3D or make it wider)

3. a) The following chart shows Pizza Sub Sales over a month. What 2 graphs would show the information accurately?

I would use Line graph and Bar Graph


3.b) If you were selling Pizza Subs would you continue? How do
es your graph explain your answer.
Yes, I would continue selling pizza subs because every week the items that are sold are increasing .The trend is going up .


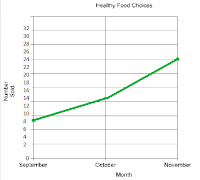
4. Below you see 2 different examples of graphs showing healthy choices sold at the canteen. If you had to convince Mrs Mota that we should continue selling healthy choices which graph would you choose?

If I had to convince Mrs. Mota that we should continue selling healthy choices I would use Line Graph.


4a) Change each graph so that your information looks even MORE impressive. You may not change the data just the graphs.

Wednesday, October 12, 2011

Charry's Proportion Post

Task 1
  • ratio: a relationship between two numbers of the same kind.
  • rate: Compares two quantities measured in different units.
  • proportion: An equation which states that two ratios are equal
example of proportion: 9 bananas cost $1.
35 . How much will 16 bananas cost?


Task 2
  1. 5 hours to travel 360 miles is about 72 mph


  2. 2.
    As a playgroup worker, if I increase the amount of apple juice I am serving at the playgroup from 25 ml to 100 ml, how much should I increase the the orange juice to, to keep the quantities in the same proportion? The orange juice is 50 ml to start with.


Task 3

3/4 = 12/16

    Horizontally
    Diagonally
    Vertically


Task 4


Task 5


  1. Does this seem fair?
    It's NOT fair.

  2. With what you know about proportion look and read what is in the image above. Does it seem just and fair? Why have you made this choice?
    I don't think its fair because the guy who stole 100 dollars will be15 years in jail, then the guy who stole 3 million dollars gets a 40 month sentence.

  3. What would you have done if you were the judge?
    If I were the judge I will give the guy who stole $100 a 3 or 2 months sentence , then I would give a 1 or 2 years sentence for the guy who stole 3Billions .